Using Data-Driven Performance Management to Improve Pretrial Systems

In recent years, the Harvard Kennedy School Government Performance Lab (GPL) has increasingly offered hands-on trainings to government practitioners to help them build sustainable capacity to improve service delivery and drive client outcomes. This has included training procurement professionals, alternative emergency response leaders, and staff working in homelessness response. Over the course of five sessions in April 2024, team members from the GPL’s Pretrial Initiative delivered tailored trainings on data-driven performance management to staff from the San Francisco Pretrial Diversion Project (SF Pretrial).
SF Pretrial works with judges to facilitate effective alternatives to fines, criminal prosecution, and detention for clients charged with a crime who are awaiting trial. SF Pretrial requested GPL support because the agency wanted to draw more actionable insights from the data it collects on pretrial clients. The agency also wanted to share that data more effectively with judges in an effort to improve pretrial client outcomes. Specifically, judges requested more nuanced data from SF Pretrial. Requests included looking at, for example, side-by-side visualizations of safety rates and risk scores, which could help inform release decisions. It could also allow judges to better understand if the pretrial program was effectively maintaining public safety and ensuring pretrial clients appeared in court.
When judges receive this kind of data, it is often the first time they can see the impacts of their release decisions and receive regular feedback about what is going according to plan. For example, with support from the GPL, pretrial staff in Harris County, Texas, analyzed compliance data weekly to determine which individuals were eligible to receive a step-down. From this analysis, judges received a list of clients in their courtroom who were eligible for reduced supervision requirements. From October 2020 to June 2022, the agency successfully adjusted supervision conditions for more than 2,200 clients without any impact on client compliance or rearrest rates during that time.
Key Insights
Here are three key insights that SF Pretrial participants learned.
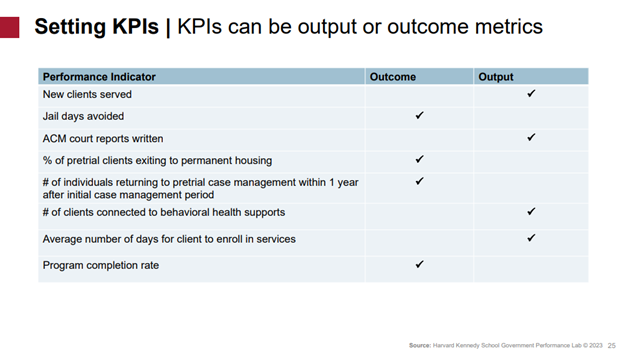
1. Select metrics that are relevant, actionable, measurable, and timely.

The GPL trained pretrial staff in San Francisco to select metrics that are:
- Relevant: Does this indicator tell us something important about service delivery? Is it tied to an important program outcome?
- Actionable: Can we make changes in response to this metric?
- Measurable: Can we measure this indicator using data we have or could gain access to
- Timely: Will we be able to see changes in this indicator on a regular basis?
Examples of strong metrics include the number of jail days avoided, the number of clients that completed a behavioral health support program successfully, and the number of clients that showed up to all court appearances. Each metric aligns with the criteria above in that they relate to core goals of pretrial agency service delivery (relevant); can prompt specific changes (actionable); are often quantifiable within existing data systems (measurable); and will fluctuate regularly (timely).
On the other hand, metrics such as the number of risk assessments completed or the number of people on pretrial supervision do not fit the criteria for a strong metric. The number of risk assessments completed is not relevant, as it measures staff productivity but does not reveal anything about the efficacy or impact of pretrial agency service delivery. The number of people on pretrial supervision is not actionable, as pretrial caseloads are dictated by the number of people getting arrested and moving through the court system, which pretrial agency staff have little control over.
During the training, SF Pretrial staff completed a worksheet on choosing metrics that included what they are currently measuring, which metrics they wish they were tracking, questions they have that data couldn’t answer, and metrics they think judges would be most interested in. GPL staff then led them through a discussion of where each metric they are measuring falls across the four criteria: relevant, actionable, measurable, and timely.
Based on the participation in this training, we will have more ability to share and receive data insights as a team. That will set us up for more opportunities to use data strategically.
Matt Miller
Senior Director of Policy and Evaluation, SF Pretrial
2. Use a long time horizon, benchmarks, counterfactuals, and qualitative data collection to strengthen descriptive analyses.

Pretrial agency data is often used to conduct descriptive analysis, which produces insights such as outcome trends for different sub-groups. This type of analysis can show early indications of program benefits or challenges, which may help pretrial staff and judges make decisions. During the training, GPL staff shared four approaches for making descriptive analysis more powerful:
- Use a long time horizon: By drawing data from at least a 6-month period, pretrial staff can better identify trends rather than one-time events. This can also help distinguish signal, or meaningful information, from noise, which is an unrelated variation or fluctuation.
- Establish a benchmark or comparison: Comparison groups can place the descriptive analysis in context. For example, can you compare the program success rates to success rates for other populations? Can you compare success rates from before and after a specific intervention, such as the addition of housing support? When benchmarks are not possible, establish goals for changes in data. For example, do you want to raise success rates to a certain amount?
- Explore counterfactuals or alternative theories: Test your primary hypothesis of what is causing a data trend by exploring other explanations. For example, was a new policy introduced? Did the sample size change? Are there any other trends related to arrest rates, disposition times, or other factors that could be impacting your data?
- Collect qualitative data: Pairing quantitative descriptive analysis with qualitative data from staff or clients can help pretrial staff further understand trends. For example, brief discussions with staff and pretrial clients may uncover additional insights about why data is trending in one direction. This is also an opportunity to contextualize the data and center it more on staff and client experiences.
My key takeaways from this training are that there are often many different interpretations of data, and one needs to be prepared when presenting data to judges. In the future, I would love to use data analysis techniques internally to identify trends, such as court appearance rates or re-arrest rates, and make program adjustments.
Erik Crawford
Own Recognizance Assistance Manager, SF Pretrial
3. Pair data visualizations with context and analysis to spur meaningful discussion.
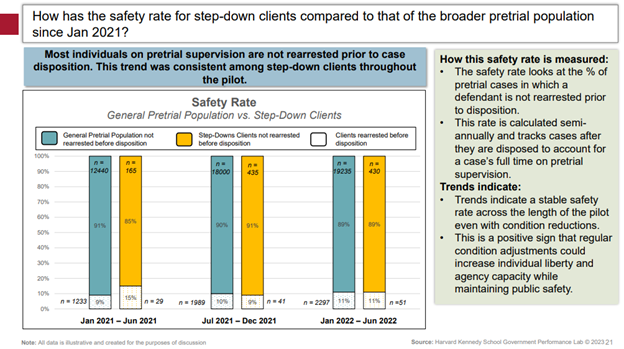
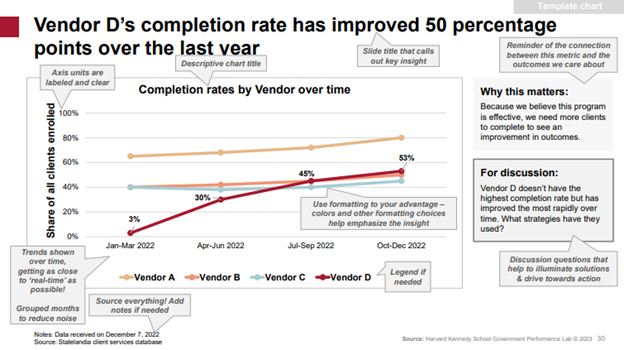
Data dashboards can be used as a tool to visualize project data, draw out key takeaways, and prompt actionable discussion and follow-up steps during meetings with judges. As shown in the example below, clear titles and headers can draw out the main insights, and call-out boxes can prompt solution-focused discussion questions.

Components of an effective dashboard include:
- A clear purpose: Include what you want to convey, what behavior you want to motivate, and how much data you need to show to do that.
- Headers and titles: Highlight key takeaways and insights from the data.
- Call-out boxes: Draw attention to specific data points, list action items, prompt action-oriented questions, and remind viewers how the metric connects to outcomes they care about.
- Color-coding and design choices: Call out the specific area you want to focus on in non-distracting ways
- Accessible text: Ensure text is easy to read and clarifies trends or proportions shown in charts.
During the training, SF Pretrial staff were split into pairs, given different sets of mock data, and asked to design one or two data dashboards to share at a quarterly program update meeting with judges or senior leadership. They then presented their dashboards and received real-time coaching from GPL staff.
A key takeaway from this training for me has been what to include on a graph to make it more effective, like call-out boxes to highlight insights or data over multiple time periods to reveal trends. I look forward to presenting to judges and stakeholders in the future. This is a skillset and training that is very important at a nonprofit like ours.
Camila Jimenez
Project Manager, SF Pretrial
What’s Next?
As the training series concluded, participants reflected on how they would leverage the skills learned to strengthen their ability to present data to judges; use data to inform program decisions, such as how to get more pretrial clients connected to services; and use data to ensure the least restrictive use of pretrial supervision conditions. Before the training, only 42% of participants said in a survey they were “somewhat comfortable” explaining data to other stakeholders, and 0% said they were “very comfortable.” After the training, 80% said they were “somewhat comfortable” or “very comfortable.”
If you work in a pretrial agency and are interested in receiving technical assistance and applied research support from the GPL, please apply to our Pretrial Initiative by June 11, 2024. The GPL’s Pretrial Initiative supports state and local jurisdictions that want to improve their pretrial outcomes while making pretrial supervision less restrictive. Using learning from work in Harris County and Illinois, the GPL is currently providing pretrial technical assistance to five jurisdictions, with a focus on:
- Assessing supervision structures to identify opportunities to right-size the intensity and cost of supervision to clients and governments;
- Creating client connections to voluntary supportive services to address underlying needs outside of the criminal justice system;
- Developing training and tools to expose pretrial system stakeholders to innovative approaches in release and supervision.
More Research & Insights


Measuring Pretrial Success: Two Scenarios for Agencies and Courts

Building a Responsive Pretrial Supervision System in Harris County, Texas

GPL Presents on the Use of Service Referrals During Pretrial Release in Alameda County, California

Measuring Pretrial Success: Two Scenarios for Agencies and Courts
