Five Elements to Include in Every Performance Dashboard

Updated on November 22, 2023 

Managers everywhere use performance dashboards as a way to visualize project data and easily track program capacity, efficiency, and outcomes. In government, we have worked with public agencies to develop and use performance dashboards to monitor and improve the performance of internal operations and external contracted service providers.  

Most of the agencies we have worked with have existing performance dashboards that they regularly review with senior leadership. But the way data is typically presented can result in passive meetings that fail to generate new insights about agency operations or facilitate the identification of possible changes to improve outcomes. 

In our work with dozens of state and local social services agencies, we have observed five design elements to integrate into every performance dashboard to enhance the likelihood that the data will lead to improvements in service delivery and outcomes for clients. These features are relevant for dashboards built both for data-driven performance management of agency providers and internal operations:  

  1. A long time horizon for trends that shows data at monthly or quarterly intervals over time (ideally, going back at least 2 years). This enables leaders to easily notice when trouble emerges, to quickly assess seasonal drivers, and to monitor if operational changes produce the intended improvements. 

  2. A benchmark, target, or reference line that allows leaders to contextualize performance and determine the urgency of possible reforms.

  3. Disaggregation by operationally-meaningful subunits (such as individual field offices or service providers), aiding leaders in identifying subunits with stronger practices that can be spread as well as subunits with weaker results (or more challenging clients) that may need additional support. 

  4. An explanation of how performance on this measure matters for client outcomes, which facilitates the design of solutions focused on producing better outcomes rather than tighter compliance. It also reduces information overload for executives by focusing attention on the metrics that matter most.  

  5. Discussion questions and guidance for interpreting trends, which together enable leaders and their teams to swiftly turn their attention to the discussion of possible operational changes. Developing effective questions for discussion often requires substantial pre-analysis by agency staff who have programmatic expertise.

Below is an example dashboard used to manage the performance of family support services, delivered by three service providers contracted by a public child welfare agency (providers A, B, and C). The dashboard contains the five elements to help drive performance discussions and action during regular data-driven performance management meetings between agency and provider executives:

DDPM Performance Dashboard

  1. Long time horizon: The dashboard shows the trend over time so agency staff can easily tell if there have been improvements or drops in the percentage of families referred who enroll in services.

  2. Benchmark: It shows this performance relative to a benchmark of 60% of families referred who enroll in services, so that providers and agency staff are able to easily determine whether or not current performance is strong.

  3. Disaggregation by subunits: It breaks down data by provider so that agency staff can easily tell that Provider A is performing strongly relative to the two other providers and look to them for best practices to spread.

  4. Explanation of how performance matters for client outcomes: It reminds staff why outreach and engagement strategies to enroll families in services are important: this ensures services are reaching and supporting families who may benefit most from the program.

  5. Discussion questions and guidance: The dashboard suggests solution-focused discussion questions for a meeting with executives from the public agency and all three providers, such as what best practices can be learned from Provider A, and what may have caused a drop in January performance by Providers B and C. These questions are framed to enable shared learning and collaborative problem solving.  

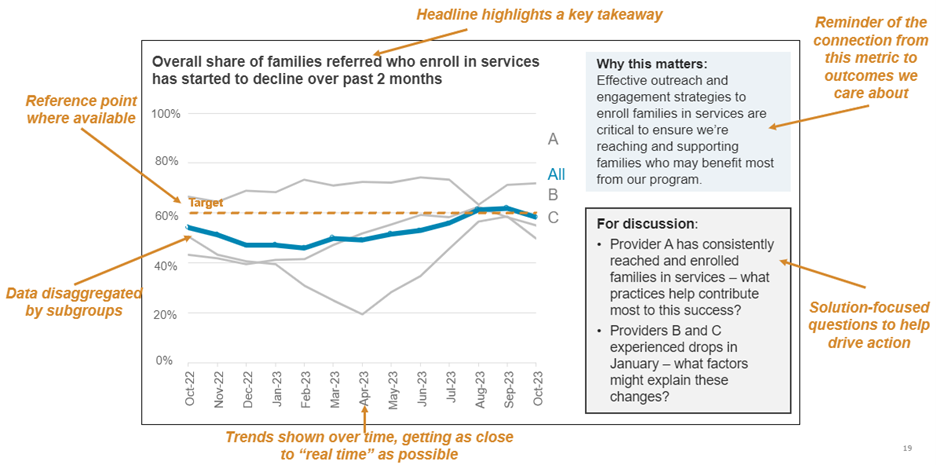
Designing dashboards with these five elements helps to set up agency staff to create meaningful insights, and then actually use those to deliver improved outcomes. Data alone is often necessary but not sufficient to drive performance. Instead, agency and provider staff need to work together to use the data to identify challenges and implement practical solutions. Incorporating these five elements into performance dashboards can set the stage for those critical conversations. 

For more information about data-driven performance management strategies, including additional guidance and examples, visit the GPL’s Data-Driven Performance Management page.

Five Elements to Include in Every Performance Dashboard155 KB