

Overview for Judges
We have heard from judges across the country about the complex decisions they face each day regarding individual pretrial conditions. Many judges seek accurate, real-time data about the outcomes of these decisions but do not always have the opportunity to review such data.
A lack of data sharing can significantly limit a judge’s ability to assess the full impact of pretrial conditions on the supervision department’s caseload and how effectively the agency supports individuals on pretrial release. This publication was created to support pretrial services agency leaders and staff as they develop and implement data-driven performance management systems — systems that ultimately benefit judges by providing greater access to essential data for daily decision making.
Through the Harvard Kennedy School Government Performance Lab (GPL)’s Pretrial Initiative Technical Assistance program, we have identified two key reasons for a lack of data sharing:
Even when judges do receive pretrial data, many are surprised by what they learn — discovering, for instance, that pretrial agencies supervise more people than expected, or for longer periods of time than intended. This can place a significant burden on pretrial staff, who, in some jurisdictions, have a monthly caseload of 50 to 500 clients they must individually supervise.
By using the data-driven performance management tools we’ve designed, judges and the pretrial agencies they work with can build skills and staff capacity to improve data-sharing practices. When judges have access to up-to-date, high-quality data, they can better reflect on the minimum level of pretrial supervision needed to maintain public safety and court appearance rates. Such reflections can also support more efficient court operations and provide judges a greater sense of control over their decisions.
This publication is designed to encourage more accurate and consistent data communication between pretrial agency staff and judges. In it, we provide examples of how staff can use program data to answer two key questions for judges:
We encourage judges to share this publication with their pretrial supervision agency/division or court administration team and express to them a desire to review data more frequently to help guide decisions.

As part of the GPL’s Pretrial Initiative Technical Assistance, pretrial staff from jurisdictions across the country have shared that they face barriers in effectively and confidently communicating pretrial outcome data, such as the number of re-arrests or compliance with supervision conditions like GPS monitoring, to judges. Pretrial leaders need resources and solutions that help them develop stronger skills to analyze pretrial program data and communicate that data to judges in ways that are straightforward, intuitive, and actionable.
This publication includes specific metrics and types of data we recommend pretrial agency leaders start with to help answer two key data questions for judges:
As we unpack each question, we provide step-by-step guidance on why it is important to be able to answer these questions and provide examples to help you get started working with your own data. We have also included examples of trends that pretrial leaders should watch for and tips for setting up a data-driven approach in their jurisdiction.
Helping Pretrial Staff in San Francisco Explain Data with Confidence
In San Francisco, the GPL delivered a data-driven performance management (DDPM) training series tailored to pretrial staff after judges requested that the agency provide more nuanced data on clients. Before the training, only 42% of participants reported that they were “somewhat comfortable” explaining data to other stakeholders, and 0% said they were “very comfortable.” After the training, 80% said they were “somewhat comfortable” or “very comfortable.”
“My key takeaways from this training are that there are often many different interpretations of data, and one needs to be prepared when presenting data to judges.”
— Erik Crawford, Own Recognizance Assistant Manager at San Francisco Pretrial Diversion Project
Why this matters: For every individual placed on pretrial supervision, pretrial staff must run several supervision checks. Staff often struggle to manage their caseload against the level of supervision needed for each client. In some jurisdictions the GPL has worked with, an individual pretrial officer’s caseload has included anywhere from 50 to 500 clients. In general, pretrial staff may conduct any or all of the following supervision services for each client, depending on the number and type of conditions they are assigned:
If a judge assigns an individual to conditions that are mismatched to their risk levels, pretrial officers must still supervise them according to the conditions that the judge assigned. This can take away from pretrial officer’s ability to monitor more high-risk cases.
Suppose a judge has not seen the data on their overall condition assignment history. They may not be able to visualize patterns or trends such as over-assigning restrictive supervision conditions regardless of risk factor, which can result in an unmanageable caseload and an overall lower quality of pretrial supervision, see Examples A and B.
Harris County Reduces Conditions for 2,200 Cases after Introducing Weekly Data Check-Ins
With technical assistance from the GPL, Harris County Pretrial Services (HCPS) piloted a “behavioral nudge” system in which judges received weekly and bi-weekly emails from pretrial staff reporting on client outcomes. Judges, the GPL, and HCPS staff worked together to look for ways to reduce unnecessary supervision conditions. Harris County stepped down supervision conditions for 2,200 pretrial supervision clients, with no changes in client compliance or rearrest rates during that time.
This also lowered the costs and harms associated with in-person check-ins, drug tests, and constant electronic monitoring. Pretrial clients said that the shifts in requirements reduced or eliminated the number of times they had to leave work, find childcare or transportation resources, and travel across the county for in-person supervision meetings.
“As the judges saw the successes of removing conditions while maintaining important measures of safety, they became very invested and were eager to participate actively in the initiative. From my perspective, it laid the groundwork for better communication between judges and Pretrial Services.”
— Natalie Michailides, Director of Harris County Pretrial Services
Key Caseload Stats:
Example Insight: Officers have shared concerns about their caseloads; on average, our officers supervise ~89 people at a time. They feel they cannot effectively supervise everyone on their caseloads.
Recommended Next Steps:
This graph answers the following questions: How many people are currently on supervision? What conditions do the individuals currently on supervision have? How has that changed in the last four months?
Key takeaways: The total caseload grew from ~160 individuals in March to over 300 individuals in June;~48% of the current caseload has a device condition.
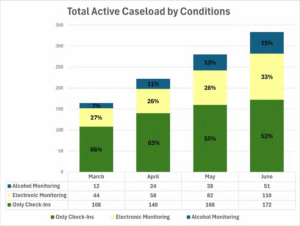
Example insight: While the pretrial services agency’s total caseload has grown since March, the proportion of cases that require device monitoring, such as electronic and alcohol monitoring, has also increased. Between March and June, the percentage of cases requiring some type of device monitoring increased from 34% to 48%, while the overall caseload increased from 164 to 333. Both an increase in cases and an increase in device monitoring suggest that pretrial agencies’ workloads are increasing.
Data to illustrate how your caseload is growing could include:
If you think your pretrial agency’s caseloads are becoming unmanageable, then you might consider using data to explore ways to right-size the caseload. Try to identify whether there are individuals who are under a higher level of supervision than necessary or who have a proven track record of returning to court and may no longer need supervision. These cases offer opportunities to right-size the caseload safely, rather than attempting to reduce it overall, which could have the opposite effect by potentially creating public safety challenges. Pretrial agencies can do this by collecting and reviewing data with your judges to answer the following questions:
How many days on average are people spending on pretrial supervision?
If people are on pretrial supervision for an extended period of time (e.g., more than 90 days) due to longer case processing times, pretrial agency leaders may consider speaking with a judge to highlight this data point and discuss reducing conditions for individuals with a track record of pretrial compliance.
How many people in my caseload have multiple conditions?
In some jurisdictions, individuals may be assigned multiple intensive supervision conditions at the same time, such as having to perform a remote breathalyzer and take a drug test. Using conditions in this way may be redundant, impose additional costs on the pretrial agency and time burden on the individual, and be mismatched to the initial charge. If pretrial officers observe that more than 20% of cases have multiple conditions or devices, agency leaders may consider reviewing these cases with a judge to remove one of the conditions.
What does my risk assessment data tell me about the risk level of individuals on different levels of supervision?
In some jurisdictions, pretrial agencies will make recommendations for release conditions or supervision levels based on a risk assessment. Ultimately, the judge decides the conditions under which the individual is released. In some cases, judges may assign individuals with a low risk score to a high supervision level as an additional safeguard. However, over-assigning conditions to clients over time may contribute to unnecessarily high caseloads for pretrial agencies.
If over 10% of cases that score low on the risk assessment are on high levels of supervision, this could be a signal to consider right-sizing the caseload by requesting that individuals with low risk scores either be placed on the lowest levels of supervision or taken off the caseload completely.
For initial condition assignments: Share program data with the judge about recent condition use trends and outcomes as a way to discuss when condition use may not be an effective practice, such as layered monitoring modalities (i.e., assigning both drug testing and device conditions).
For continued conditions use: Request a biannual review of individuals with conditions, organized by various subgroups, such as individuals with multiple devices or individuals who have been on devices for an extended period of time with full compliance (e.g., more than 90 days).
This graph answers the following questions: How many people were placed onto supervision this quarter? What supervision levels were they placed on? What were their risk scores? How do their risk scores compare to their supervision levels?
Key takeaways: Of the ~3,100 people placed on supervision this quarter, more than half were placed on high levels of supervision (Levels 3 and 4). Most individuals placed at these levels were also identified as low-risk. This indicates a mismatch between risk scores and supervision levels.
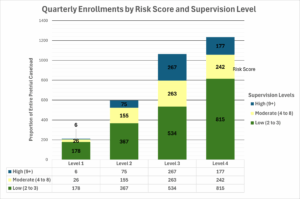
Example insight: Individuals with “low” risk scores are frequently being assigned to high supervision levels. Last quarter, 50% of all individuals on Level 3 Supervision and 66% of all individuals on Level 4 Supervision received a low risk score. There suggests potential overuse of pretrial supervision conditions, which may be contributing to a larger overall caseload without improving public safety or appearance rates.
Signs that supervision assignments are contributing to a bigger caseload: Low-risk clients being assigned to a high supervision level. These individuals could usually be released on their own recognizance or may require minimal monitoring. A growing caseload may be caused by a variety of factors. It may be a sign that more people were charged recently or that less people are in pretrial detention. These trends are not often within a pretrial agency’s control.
Why this matters: Judges decide whether an individual can be released pretrial and, if they choose to release the individual, assign pretrial supervision conditions. Typically, judges make these release decisions using a combination of the individual’s risk assessment score (using a public safety risk assessment tool) and recommendations from pretrial services, along with other decision-making processes.
Judges have shared with the GPL that they are accustomed to receiving news of adverse client outcomes, such as noncompliance and rearrests. This perspective overlooks the broader context and can lead to the misconception that most individuals on pretrial supervision are not complying with release conditions. While judges may not have the capacity to review compliance reports for all individuals on supervision, providing overviews of court appearance1 and safety rates2 can help them to understand that pretrial supervision is often a safe option. This data can help judges build trust in pretrial supervision as a release option, increase their uptake of various pretrial release options, decrease their use of pretrial incarceration, and use less restrictive conditions more frequently.
This graph answers the following questions: How many people made it to their court appearances and remained arrest-free? How has that changed from quarter to quarter?
Key takeaway: Pretrial outcomes have been relatively stable over the last six months.
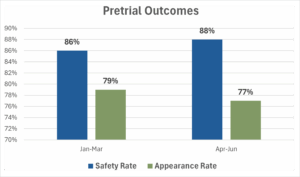
Example insight: On average, pretrial outcomes, including safety rates and appearance rates, have been stable for the last two quarters. This could indicate that pretrial supervision continues to be a strong option even for individuals with a higher risk score, or who would have otherwise entered pretrial detention. This trend may also indicate that recent supervision assignments are having the intended impact on helping clients avoid re-arrest and supporting individuals to return to court for their case hearings.
Trends to watch for: Significant changes in the safety or appearance rate (five or more percentage points between two quarters).
If your pretrial outcomes have been declining over the last six months, then you might consider using data to uncover additional patterns to help you understand why and be better prepared to explain those trends to a judge. Pretrial agencies can do this by collecting and reviewing data with your judges to answer the following questions:
Other factors to consider
Pretrial outcomes may naturally shift over time. For example, pretrial agencies we have worked with often report lower court appearance rates in the summer when parents have more childcare responsibilities and may find it harder to make it to court.
Pretrial outcomes may also decline due to factors within the pretrial system’s control, such as individuals being supervised at a level that is mismatched with their risk assessment score, program or policy shifts that have impacted outcomes4 , or because individuals have not been offered additional supportive services that would facilitate pretrial success, such as referrals for substance use counseling.
Pretrial leaders should share with judges details about the type of risk assessment tools used in the jurisdiction, so judges understand more about where recommendations come from. (A national survey of pretrial risk assessment tools found that about two dozen different risk assessment tools are used across the country.) You might do this by revisiting the relevant state statutes or discussing any recent updates to the tools and how these rules and regulations impact individual scores.
Using the GPL’s data-driven performance management (DDPM) framework, we have identified four communication strategies to help pretrial agencies translate program data on client progress into clear insights when communicating with judges:
The following strategies are based on key takeaways collected during the GPL’s Pretrial Initiative’s Technical Assistance work in Harris County, Texas; Las Vegas, Nevada; Clark County, Washington; and Santa Cruz County, California.
Consider: What does a judge need to know about this information to trust it and use it to inform their behavior?
Judges may have questions about how pretrial staff came to certain conclusions, what the data are measuring, or where the data came from. Be prepared to answer questions about how you or someone on your team analyzed the data.
Here are some elements you might include in your presentation of program data:
Consider: How does the frequency of feedback provided to judges impact their ability to make decisions tied to client outcomes in real time?
Many judges have said that they appreciate frequent data sharing to provide regular feedback, reflect on progress, and understand the impact of their decisions on client success. Consider the difference between an annual report and a high-frequency, periodic report that a judge might receive from their pretrial division.
| Data Judges Might Review in an Annual Report |
Data Judges Might Review in High-Frequency DDPM Process |
|---|---|
| • # of Public Safety Assessments pretrial agency staff completed • Average annual concurrence rate5 • Average daily population receiving pretrial services • # of individuals on Supervised Own Recognizance (SOR) • # of individuals monitored for the year • % change in pretrial population, year to year • % of clients with monitoring equipment • Annual Success Rate, Safety Rate, and Appearance Rate |
• Changes in supervision level assignments over time • Changes in safety rate and supervision success rate quarter to quarter • % of clients that judges placed on intensive conditions over time compared to other courts • Cost savings for clients and pretrial agency via condition adjustments made by judges • Client Impact: Anecdotes from clients on condition removal experience |
Consider: Do the data reveal something your judge should worry about, or is everything operating as expected?
Judges may not be aware of how pretrial conditions impact client success. Therefore, it is important to clearly identify any implications from the data you are presenting. For example, if a greater proportion of cases in a specific court are assigned to a higher level of supervision, then that may result in an increase in the number of clients violating conditions overall. Similarly, assigning restrictive conditions to low-risk clients may increase the average amount of work pretrial staff must handle.
Other Frequently Asked Questions from Judges:
Consider: What are the specific actions a judge can take to facilitate better client outcomes?
You may identify several challenges with a client’s ability to manage and complete their supervision conditions. For example, a monthly drug test may require clients to pay a service fee, or a mandatory in- person check-in may result in clients missing work. However, many of these concerns are not immediately visible to a judge, as they are often more concerned with their responsibility to protect public safety. Here is a short list of common actions pretrial agencies may propose for judges to consider:

Preventing Child Welfare Contact

Preventing Child Welfare Contact
Preventing Child Welfare Contact
Preventing Child Welfare Contact